Hi guys,
I’ve found myself discussing garbage collecting in the JVM a few times this week and though I’d share this information with everyone that ever wondered how all this works.
Automatic Garbage Collection
Automatic garbage collection is the process of looking at heap memory, identifying which objects are in use and deleting the unused objects. An in-use object, means that some part of your program still maintains a pointer to that object. An unused object, or unreferenced object, is no longer referenced by any part of your program. So the memory used by an unreferenced object can be reclaimed.
In a programming language like C++, allocating and deallocating memory is a manual process. In other languages e.g. .net and Java, the process of deallocating memory is handled automatically by the garbage collector.
Basic Process
Marking
The first step in the process is called marking. This is the activity of marking what parts of memory have references and which have not.
Deletion
The second part is removing unreferenced objects, The deletion can be normal or can also include compacting.
Stop the world
When a gc happens all the threads in the application are stopped in what is referenced to as a “Stop the world” event.
JVM Generations
Having to mark and compact all objects in the JVM is inefficient, as more and more objects are allocated the list of objects grows and grows leading to a longer GC time. Empirical analysis of applications has shown that most objects are short lived.
Generations
The Hotspot JDK is broken into the following generations.

Note not all JDK’s have the same structure
In this post I’m referring the the SUN JDK6 only. I’ve not really used the JDK7 that much except for personal projects, but even that is different with the G1 (Garbage First) and JDK8 will be a game changer again…
Sun Hotspot
The Young Generation is where all new objects are allocated and aged. When the young generation fills up, this causes a minor garbage collection. Minor collections can be optimized assuming a high object mortality rate. A young generation full of dead objects is collected very quickly. Some surviving objects are aged and eventually move to the old generation.
The Old Generation is used to store long surviving objects. Typically, a threshold is set for young generation object and when that age is met, the object gets moved to the old generation. Eventually the old generation needs to be collected. This event is called a major garbage collection.
The Permanent generation contains metadata required by the JVM to describe the classes and methods used in the application. The permanent generation is populated by the JVM at runtime based on classes in use by the application. In addition, Java SE library classes and methods may be stored here.
Classes may get collected (unloaded) if the JVM finds they are no longer needed and space may be needed for other classes. The permanent generation is included in a full garbage collection.
GC Process
In the simplest of terms:
- New objects are allocated into the eden section of the heap. after the first GC if they are still referenced they are aged and moved to the S0.
- On the next GC, any referenced objects in eden are moved into S1, also the objects in S0 if still referenced are aged and also moved to S1.
- The process repeats alternating between S0 and S1 until the objects are aged enough to become eligible for the old age pension and are promoted into the tentured generation.
Show me the memory!
So enough talking, show me the money as Cuba Gooding once said ;-)
The simplest way to visualize the GC in operation is to open the %JAVA_HOME%\bin\jvisualvm
When you run it for the first time it will ask you to click OK to calibrate so do this.
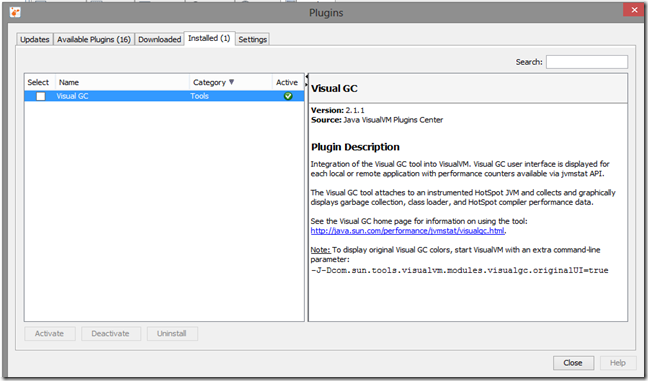
You will need to go to Tools/Plugins/Available Plugins and choose VisualGC (i’ve it already installed hence you see in a different tab)
You can then double click on the java application you wish to profile (I chose Weblogic Application Server) and you can see the GC minor collections in progress.
Shows the WLS server starting up and the Eden space starting to fill.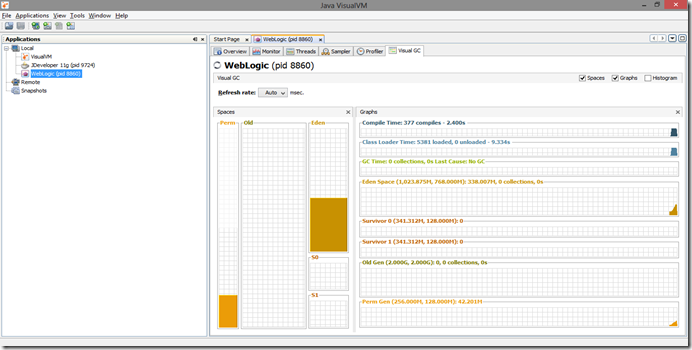
Shows the Survivor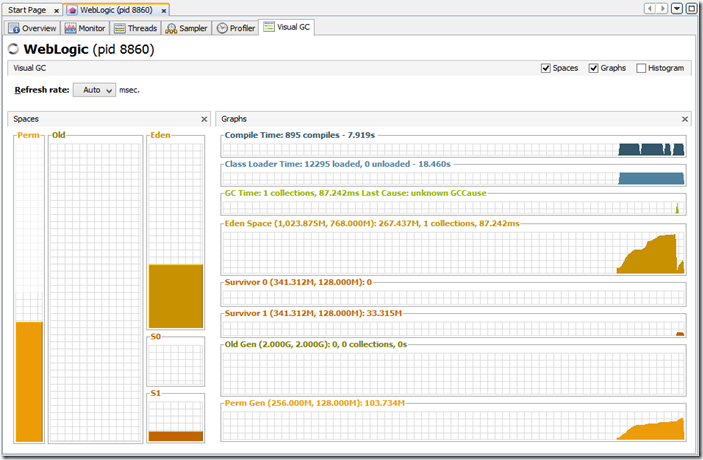 1 getting the first aged references
S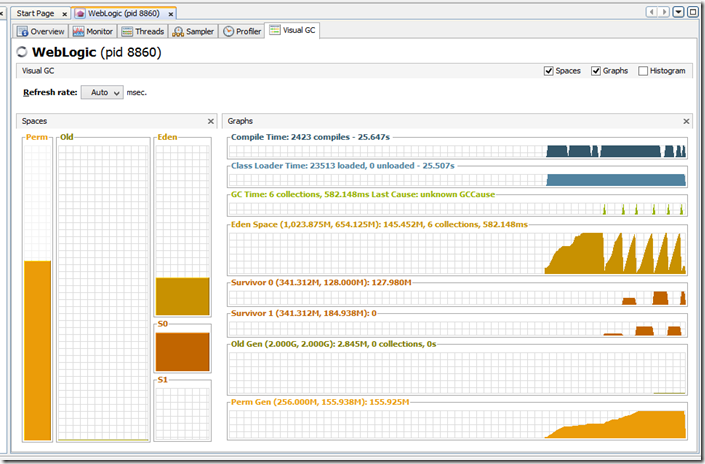 hows the minor GC’s and the alternating between S0 and S1
Shows aged survivors getting their old age pension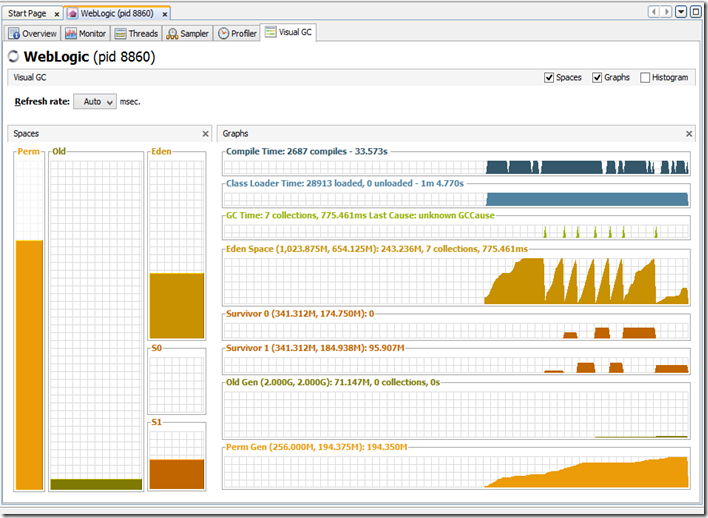
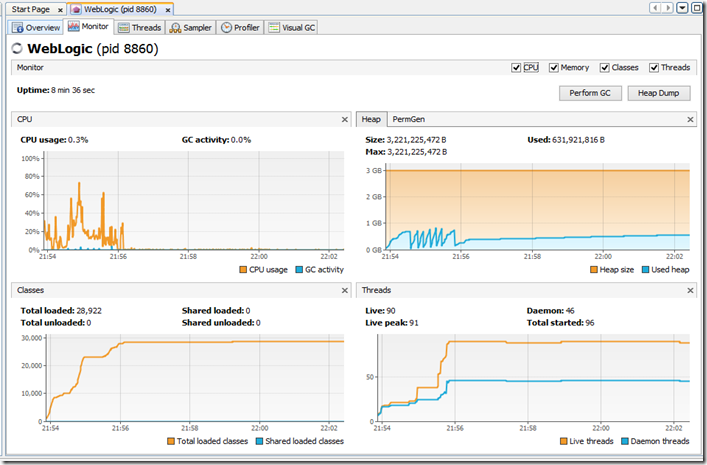
You can look at the monitor tab to get some more diagnostics,
Number of threads / Classes etc
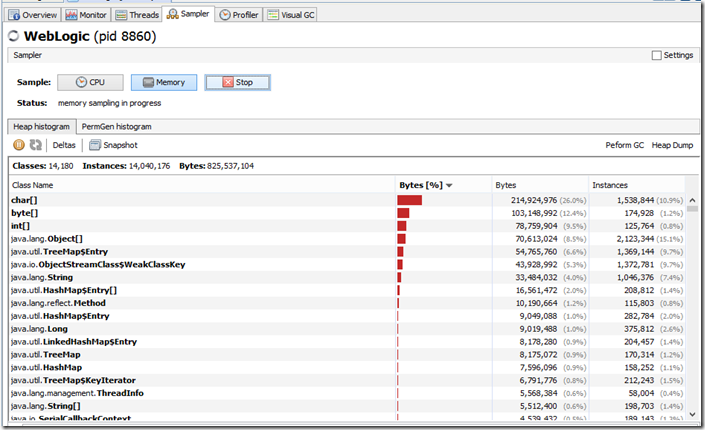
 You can see what types of objects are holding memory
NewRelic
Another tool I recommend when instrumenting applications is NewRelic.com not only will you get JVM stats, but you’ll get so, so, so, sooo much more, you just have to use it to believe it.